Drum roll please! At long last, I bring you the results of a great deal of testing. Here’s the background:
- SharePoint Development Productivity and Virtualisation Technologies
- SharePoint 2010 Development Environment Performance Tests
I’ve said my preamble in those posts, so I’ll cut to the chase here.
High-Level Summary of Findings
-
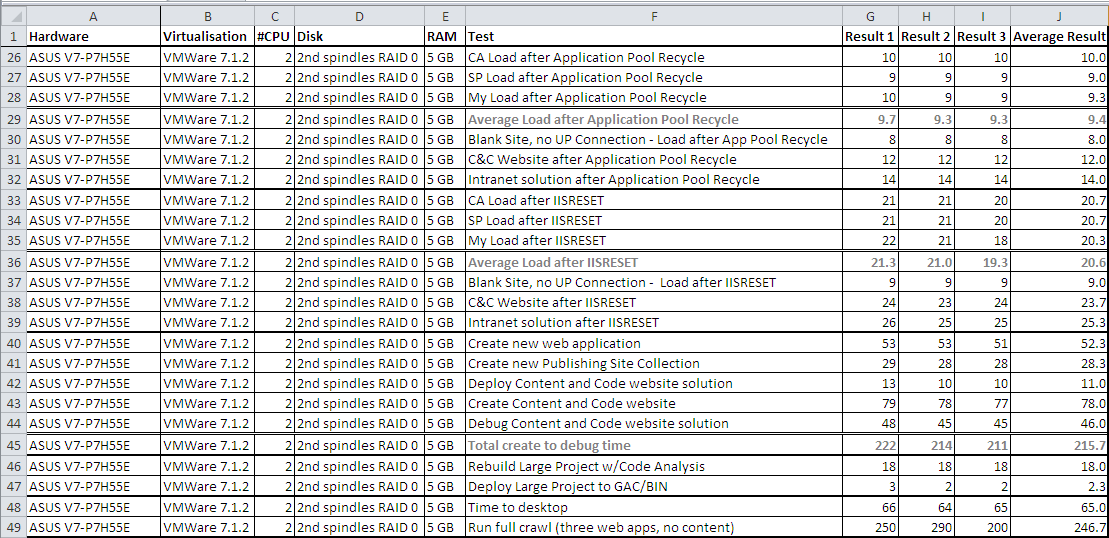
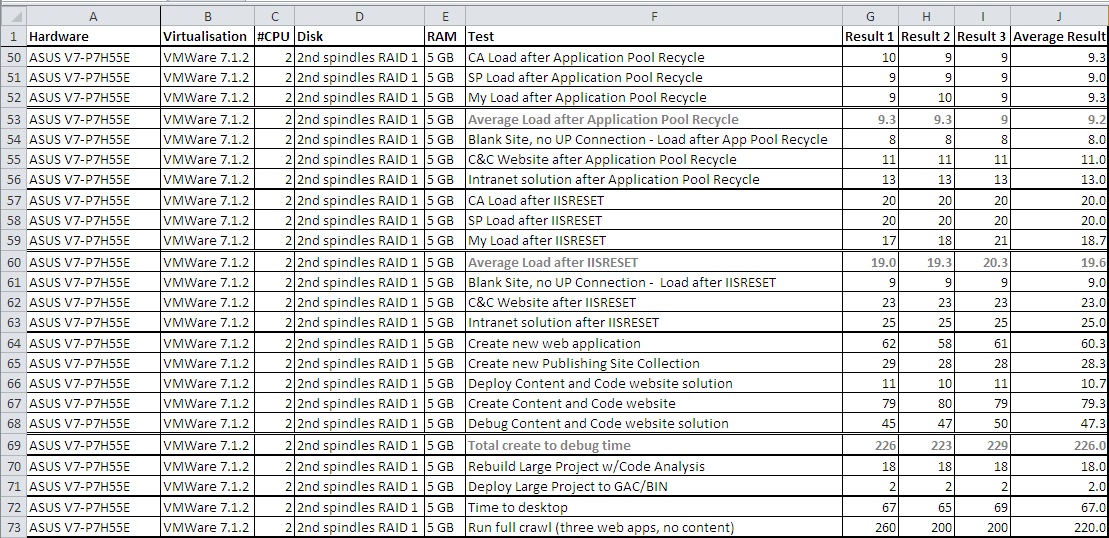
Disk performance and bus speed did not prove to be significant factors in these results (except for virtual machine start-up times). Obviously there are fundamental differences about SSD (yet untested) that may skew this picture, but I will be surprised to see big differences. If we’ve got these tests right, and they are actually representative of the tasks that slow down development, then we would expect to see wider variance across bus or disk speeds. We don’t.
-
This assumes the disk is relatively uncontended. Virtual machine performance degrades in every type of test while large file operations are running concurrently on the same disk. This could be copying an ISO, importing or exporting a virtual machine or any other sustained large file operations.
-
At a minimum, this is certainly an argument for running VMs on their own spindle, whether it’s over USB, eSATA or SATA. This may be an area where SSD shines.
-
- These disk performance figures can be found towards the bottom of this post. Desktop performance was nearly identical running on USB2 at 5400 RPM versus a RAID0 stripe or a RAID1 array on 7200 RPM disks. Laptop performance was also nearly identical over USB2 5400 RPM versus eSATA 7200 RPM.
-
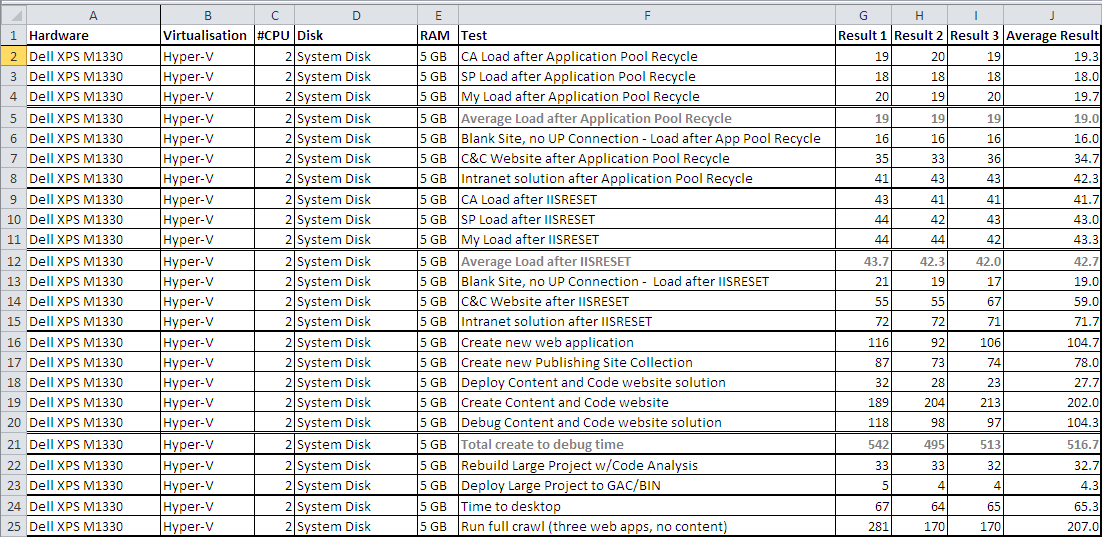
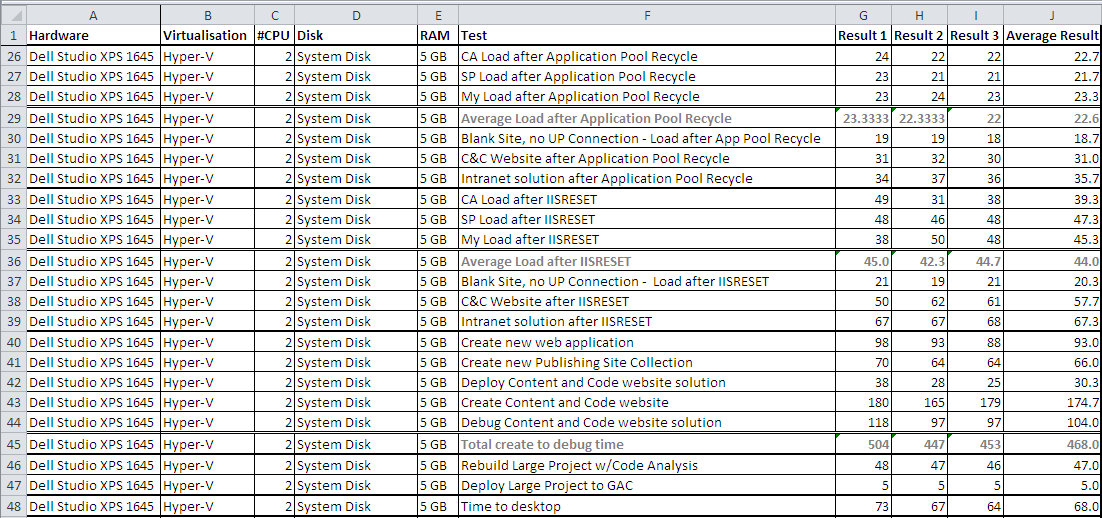
- Hyper-V performance has been poor on all laptops with i-Series CPUs. This is more pronounced in some areas than others. Our three-year-old model with a Core 2 Duo actually outperforms the new i7 in some cases. When these results are added to known driver issues with Hyper-V on many newer laptop GPUs, we’re looking at a configuration that’s unfit for SharePoint 2010 development.
-
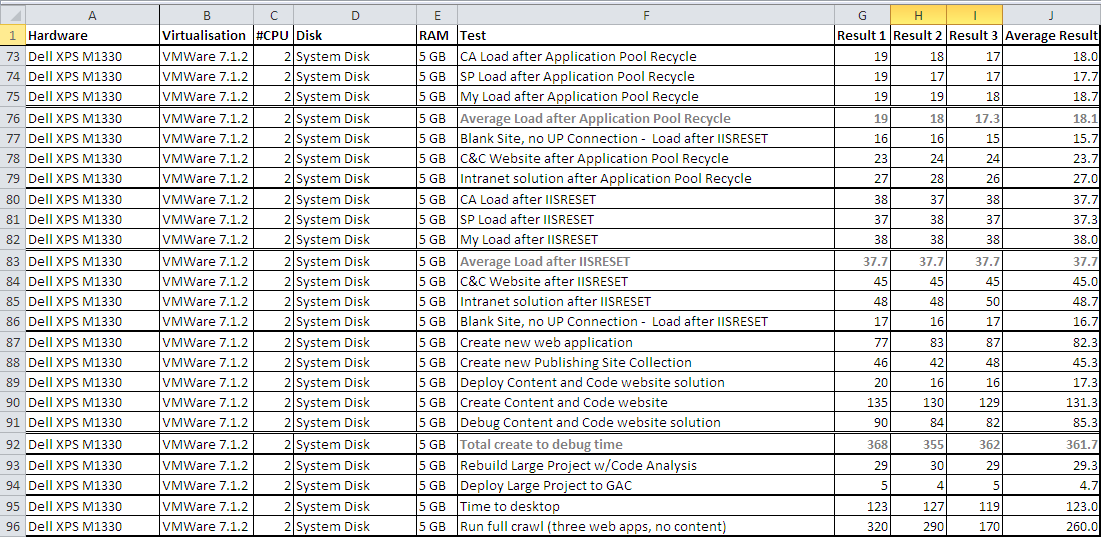
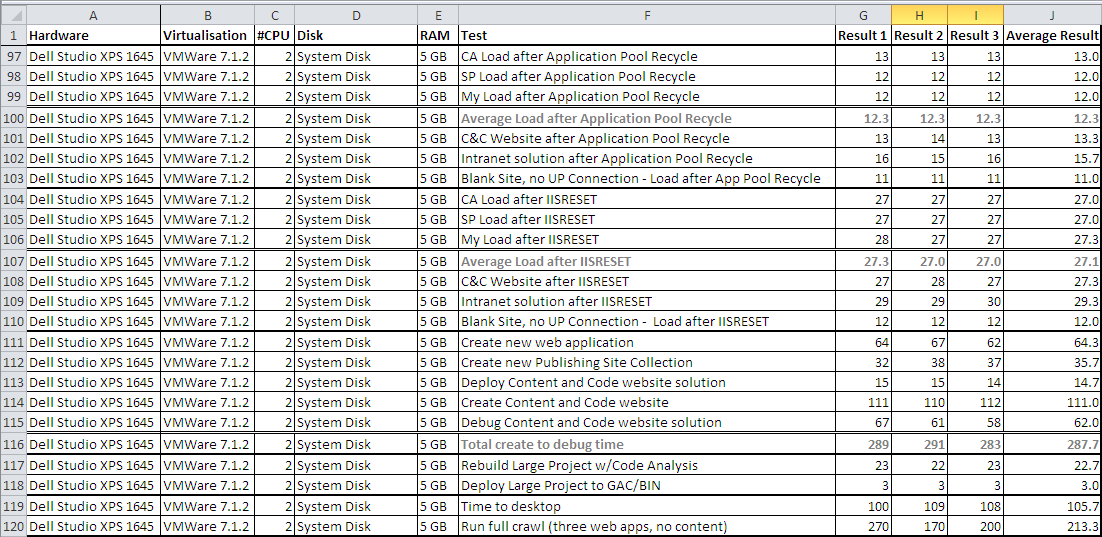
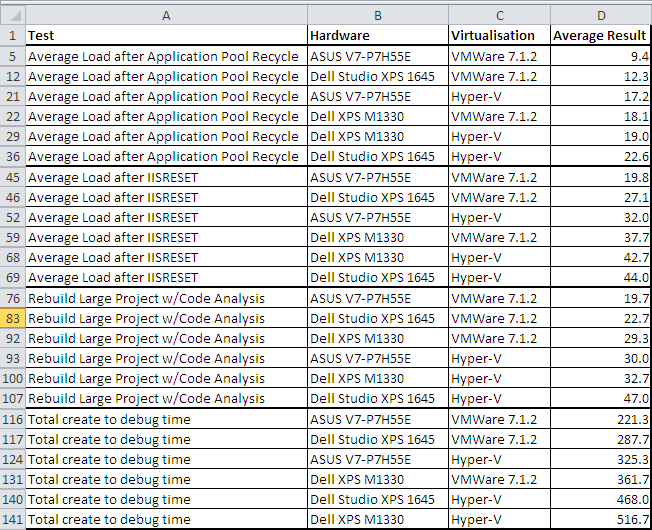
VMWare Workstation outperforms Hyper-V on laptops by significant margins in most areas. The exceptions to this are start-up time and performance during the first 10-30 minutes of use (I believe VMWare is ballooning during this time). After that, VMWare Workstation is faster than Hyper-V in every type of test.
- As a long-time advocate of Hyper-V despite usability deficiencies, I was probably more surprised by the significance of these differences than anyone. I wrongly assumed that Type-I hypervisors would outperform Type-II in nearly every way. While that may hold true on server class hardware, it doesn’t hold true here. I’m a convert.
-
While less pronounced, these same findings hold true on the desktop.
- Desktop performance is very quick on VMWare Workstation, considerably out-performing even Amazon EC2.
- We can realise significant productivity gains by moving all users who are primarily office-based to a desktop + VMWare Workstation configuration from laptop + Hyper-V, at a fairly small cost (probably half the cost of EC2 over three years – see my recent posts on EC2 for more information).
- Desktop performance on Hyper-V, while notably slower than VMWare Workstation, is generally faster than VMWare Workstation on the i7 laptop.
-
Laptop performance is significantly improved on our current model with VMWare Workstation. These improvements are also realised on the newer model laptop, but the performance delta between the two physical systems is not so significant that it’s compelling to move to a low speed i7 from a reasonable speed Core 2 Duo.
- The total times for the “End-to-end site creation to debugging tests” were two and a half minutes faster with VMWare Workstation compared to Hyper-V on the Dell XPS M1330. Moving from Hyper-V to VMWare Workstation for laptop users is now an obvious choice.
-
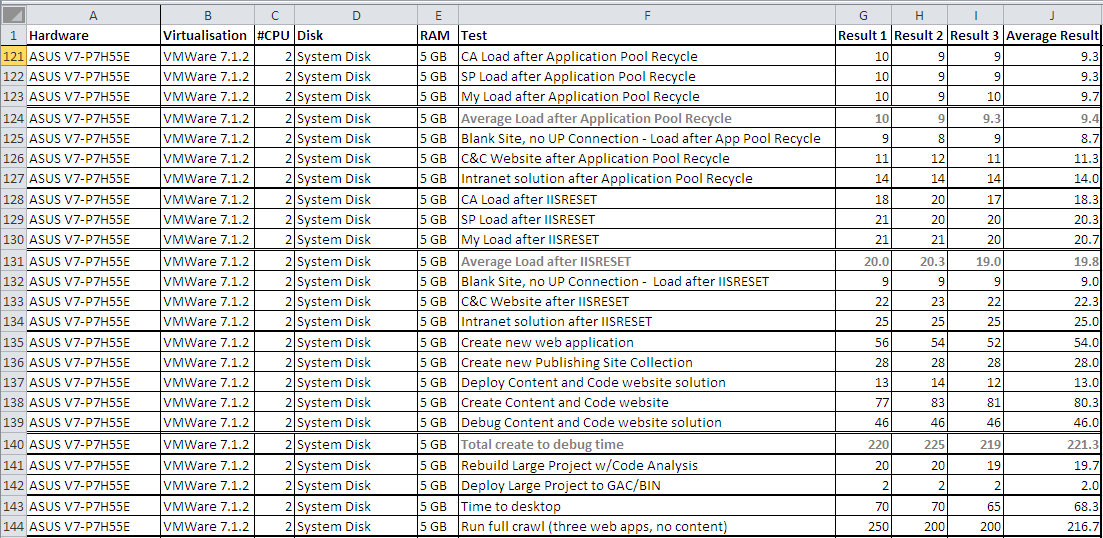
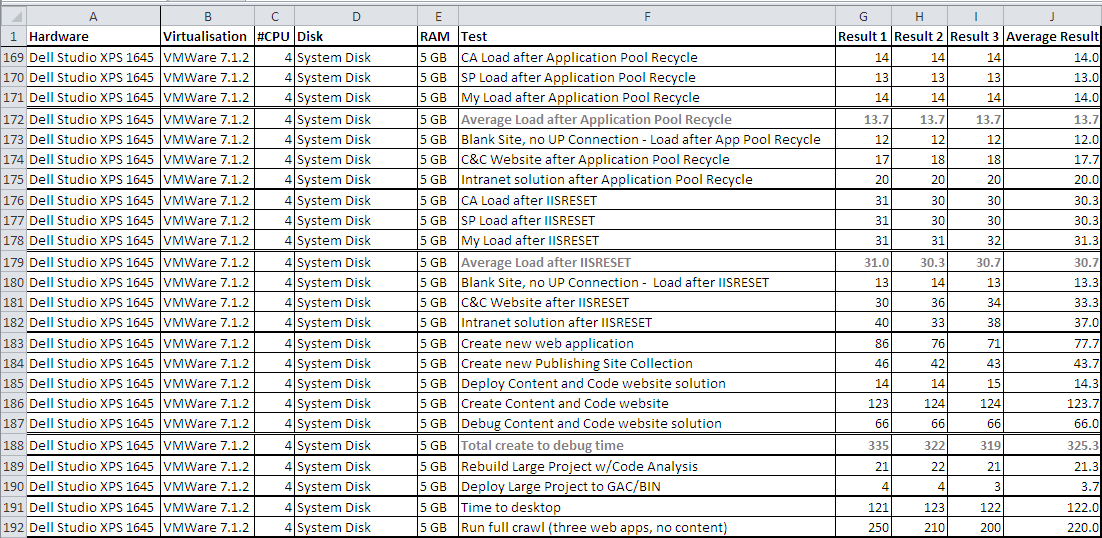
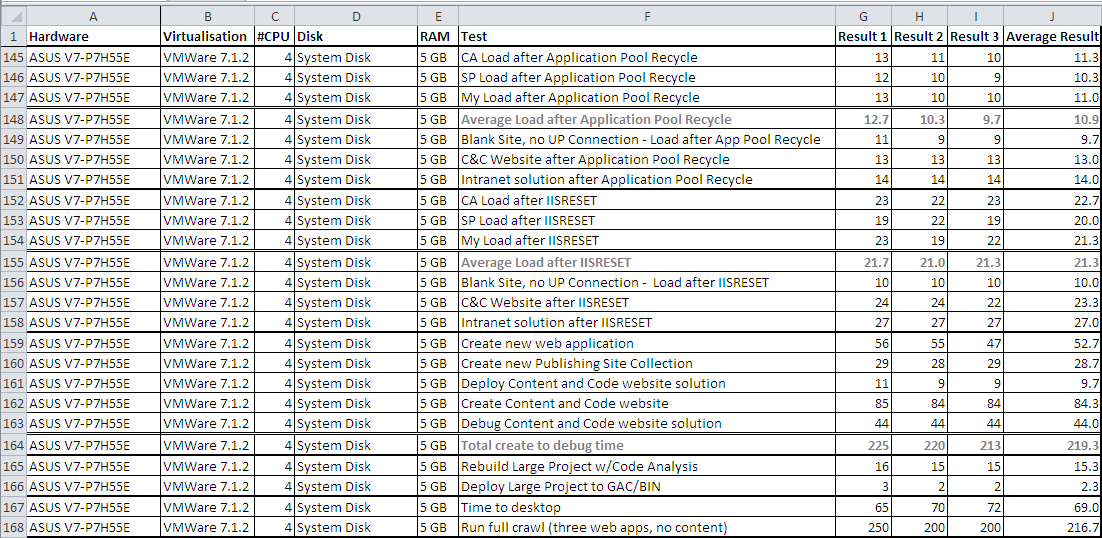
The benefit of spending on i7 processors is in doubt. We are seeing very minor performance penalties when adding more than two CPUs in both VMWare Workstation and Hyper-V for most tests. There were also very minor improvements for some tasks, but on the whole there does not appear to be a measurable benefit. This might vary if the host OS is doing a great deal with the CPU, but that is liable to cause other contention issues than just in the CPU (on a laptop).
-
The only tasks that appeared to use all 8 cores in a SharePoint VM were:
- Retract/Deploy of a solution (but only very briefly)
- Create web app, or Create site collection (but at low percentages)
- Rebuild with Code Analysis (but not fully)
- We will be running future tests on i5 processors at higher clock speeds to see how these models perform relative to the 1.6 GHz i7.
- The User Profile Service Connection doubles first page load times after an IISRESET in all test cases. I consider this a full validation of these preliminary findings.
Snapshot of key data
The Data
How to read the data:
- Hardware: the physical laptop or desktop model (or Amazon’s EC2)
- Virtualisation: “Hyper-V” is short-hand for the Hyper-V role in Windows Server 2008 R2. “VMWare 7.1.2” is short-hand for VMWare Workstation.
- #CPU: the number of physical CPU presented to the guest operating systems. Multiple logical cores were only tested in the 4×2 results below.
- Disk: the physical disk configuration where the virtual hard drives are running.
- RAM: the amount of RAM running inside the SharePoint Server 2010 VM. The Amazon EC2 instances were “large instances” but the domain controller was running locally.
- Test: The tests have been described in more detail in my last post.
- Result 1, 2, 3: Each test was carried out three times. The far-right column, Average Result, is an average of the three.
- The Two “Average Load…” rows are an average per-result of the three rows above them. These are tests built on SharePoint 2010 default site templates, which anyone should be able to replicate.
- The “Total create to debug time” row is a sum of the five rows above it.
- All results are in seconds. In cell G21 below, 524 seconds = 9 minutes and 2 seconds.
- For more information on the tests and the testing methodology, see my last post.
Hyper-V versus VMWare tests, all other things being equal
Dell XPS M1330, running Hyper-V
Dell Studio XPS 1645 laptop, running Hyper-V
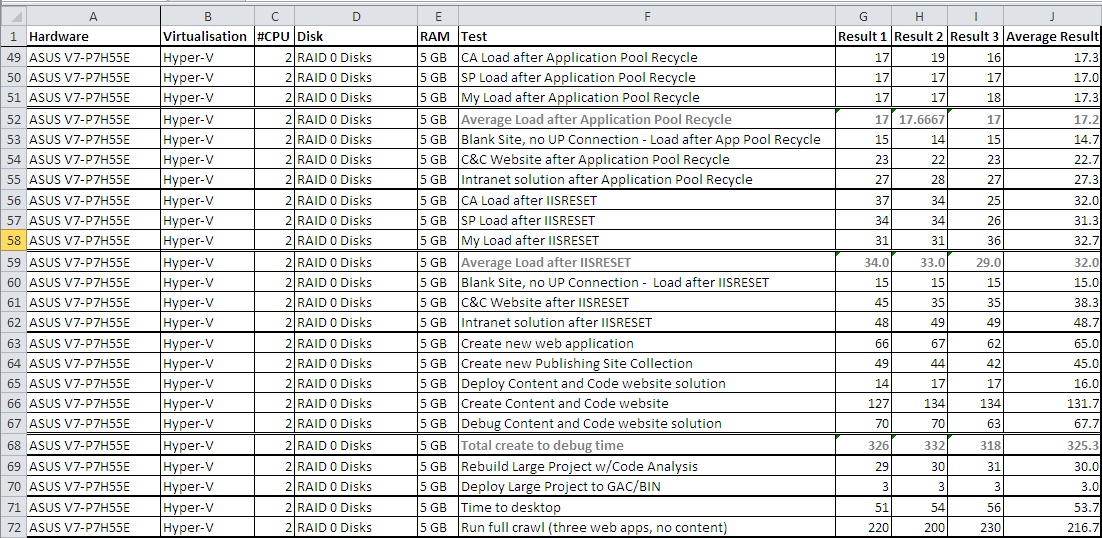
ASUS V7-P7H55E desktop, running Hyper-V
Note: these Hyper-V tests were accidentally carried out while the VM was running on a RAID 0 stripe rather than on the System disk, so this is not apples and apples, but later disk tests on VMWare Workstation indicated that this shouldn’t make much of a difference, so I’ve left these results in, with this comment.
Dell XPS M1330, running VMWare Workstation
Dell Studio XPS 1645 laptop, running VMWare Workstation
ASUS V7-P7H55E desktop, running VMWare Workstation
VMWare Workstation i7 tests with 4 or 8 cores
Dell Studio XPS 1645 laptop, running VMWare Workstation with 4 CPU
ASUS V7-P7H55E desktop, running VMWare Workstation with 4 CPU
Dell Studio XPS 1645 laptop, running VMWare Workstation with 4 CPU, 2 Cores Each
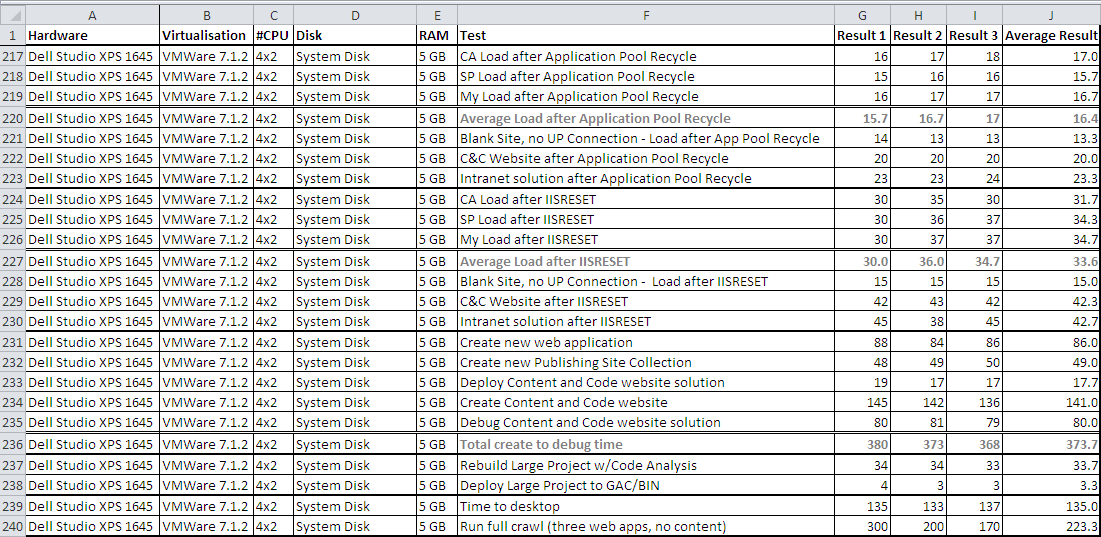
ASUS V7-P7H55E desktop, running VMWare Workstation with 4 CPU, 2 Cores Each
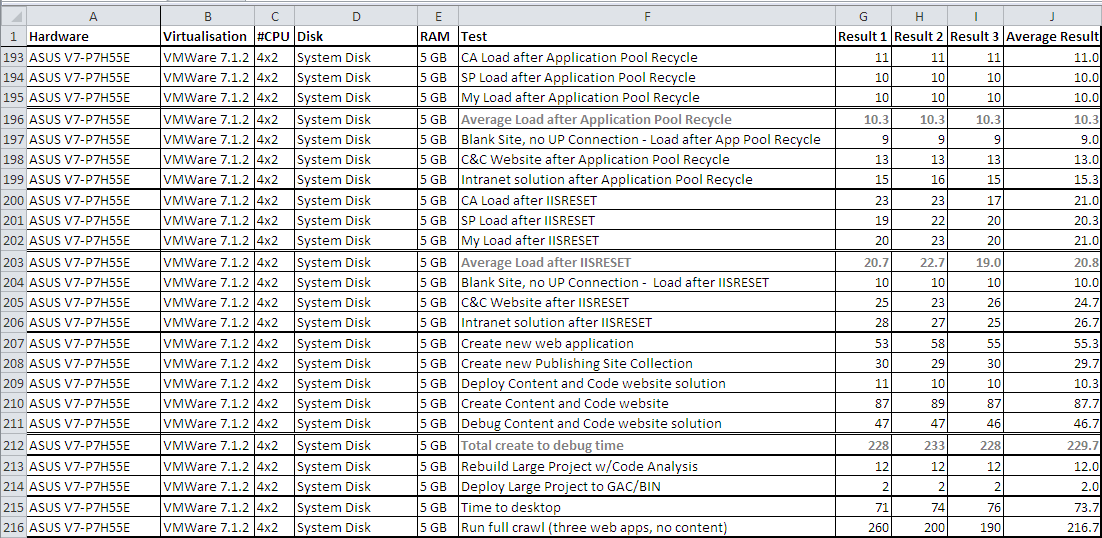
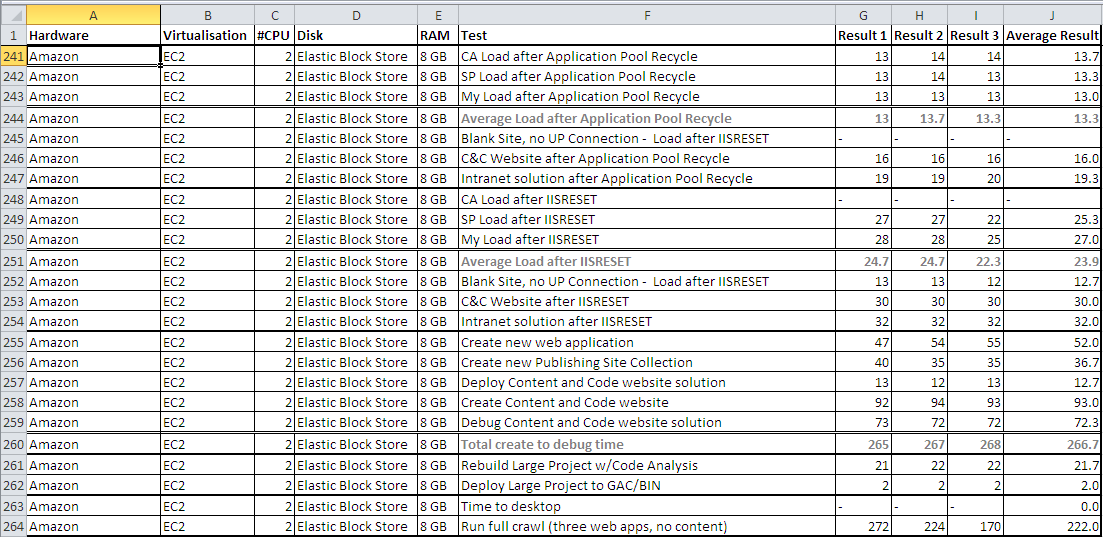
Amazon EC2 Results
Notes:
- Times were much slower one day than others. This hasn’t been measured over time, but it’s worth keeping in mind. Other EC2 users reported similar problems on the same day.
- Also note: a couple of rows of test data (245 and 248) have been accidentally deleted, but the results were not unexpected in any way.
- Row 263 has no data because measuring time to desktop with EC2 would be too imprecise. It would normally be available within five minutes from start, for reference.
Disk Tests on VMWare Workstation with two cores
The format of these tests change slightly, as I am grouping all disk permutations for the Dell Studio XPS 1645 together, then moving on to the ASUS V7-P7H55E desktop. I grouped them this way because the tests were fundamentally different for laptops and desktops. I did not get the time to repeat the laptop tests on the Dell XPS M1330.
Dell Studio XPS 1645 laptop with VM running on 5400 RPM USB2
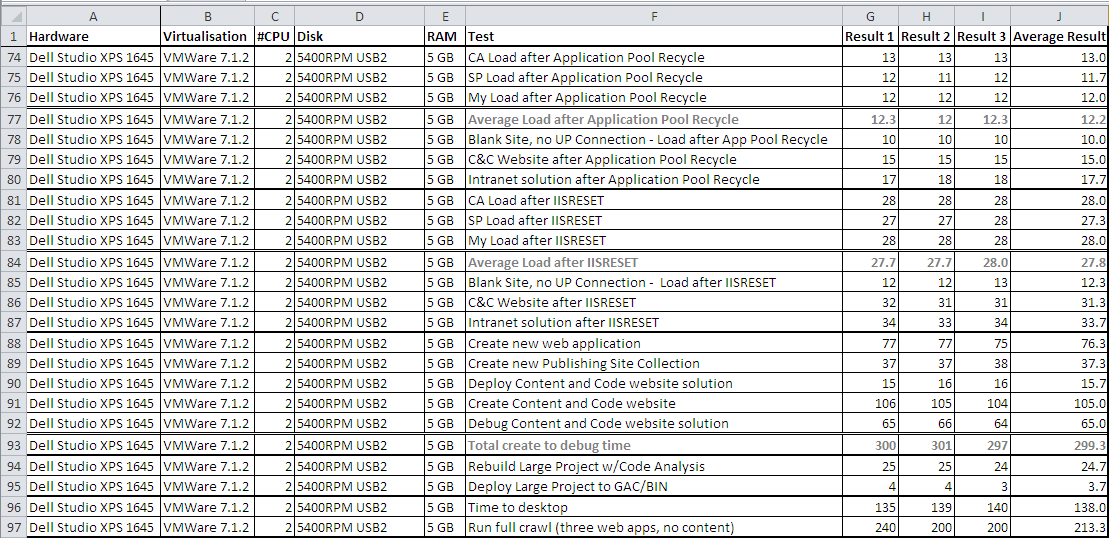
Dell Studio XPS 1645 laptop with VM running on 7200 RPM eSATA
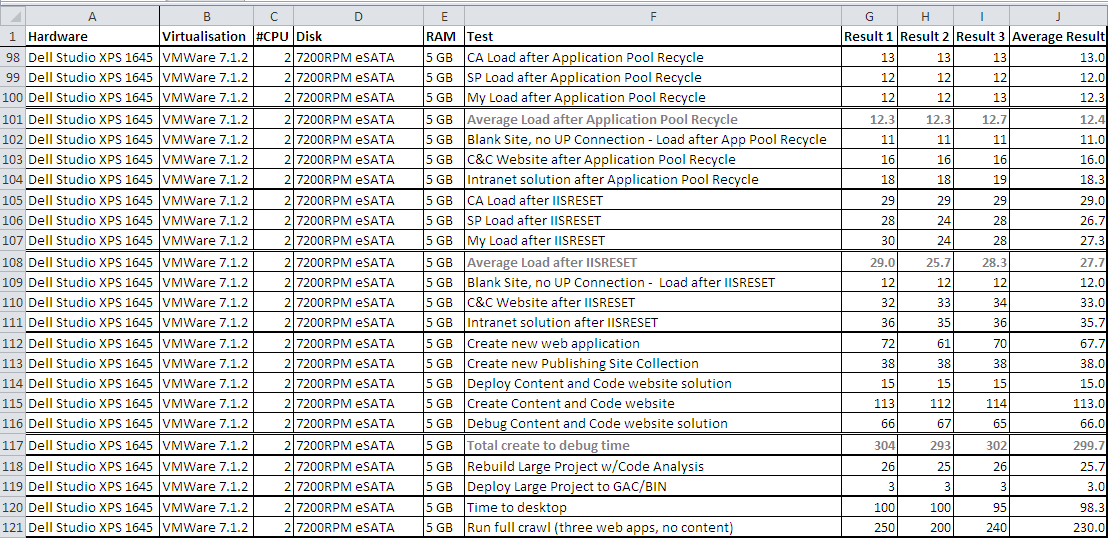
ASUS V7-P7H55E desktop with VM running on 5400 RPM USB2
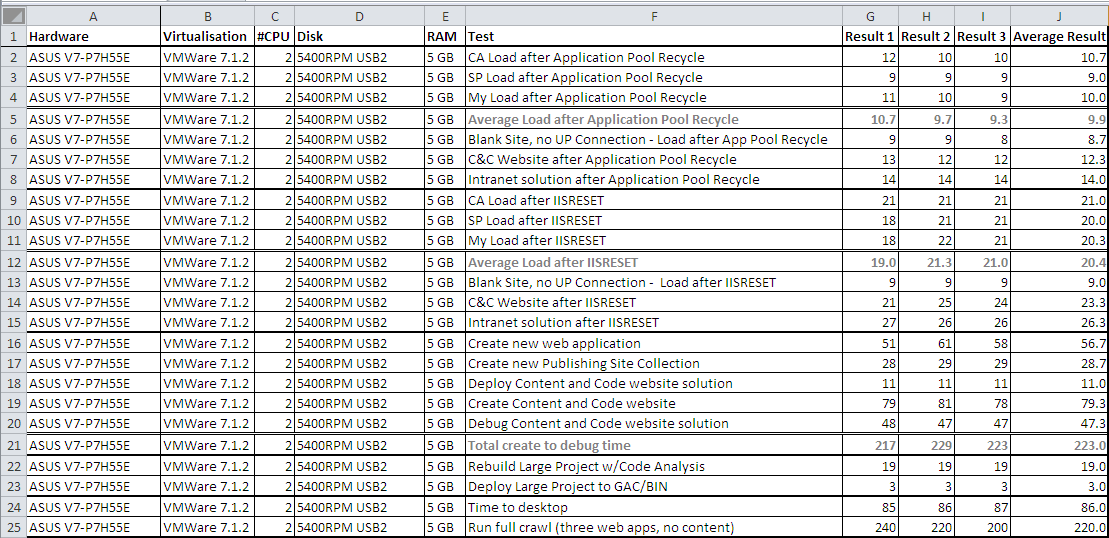
ASUS V7-P7H55E desktop with VM running on a 2nd set of RAID 0 spindles
ASUS V7-P7H55E desktop with VM running on a 2nd set of RAID 1 spindles
…and with that, I’ll let you draw your own conclusions. Should anyone want to contribute supplementary test data in the comments here, or carry out further tests (perhaps with SSD), I would love to see the results. As I mentioned in the last post, there’s still more testing to do.
Update 08 June 2011:SharePoint 2010 Development Environment Performance: SSD, i5 vs. i7, WEI and Sandy Bridge
Wow. Thanks for the incredibly detailed posts Tristan – really appreciate all the effort you’ve gone to here. Some really surprising results in there.
Would I be right in concluding that as a rule of thumb the following applies:
1) Use VMWare over Hyper-V (would like to see Virtual Box v VMWare results!)
2) Desktop outperforms laptop
3) Intel ‘i’ processors are currently not a ‘no-brainer’ and in fact a good older processor may perform better
(I know you don’t like ‘rules of thumb’ but it helps mere mortals like me…)
Thanks again
Morning. 1+2 yes. 3 needs more testing. Clock speed may be the big factor in the desktop outperforming the laptop. Vince was saying he’s read about people overclocking i5s with great results. We’re going back to do more testing on the Latitude E6410 in the new year. I’m curious about VirtualBox vs. VMWare as well. But for now, I’m on leave, so I’ll pick it back up in 2011.